Project Nsight
Mission: Create a web application concept to identify potential law enforcement threats.
Deadline: ~30 days
Deliverables: Mid-Fidelity Wireframes, Visual Design
Team: +4
Snapshot:
- Challenge: How can we design a robust application that allows users to quickly analyze data to make immediate decisions or future decisions?
- Process/Strategy: I requested the updated data models to have a firm understanding of the type of latest data available for visualization.
-
- Key Features: Smooth & Succinct Data Visualization, Prescriptive Data Integration, Power BI
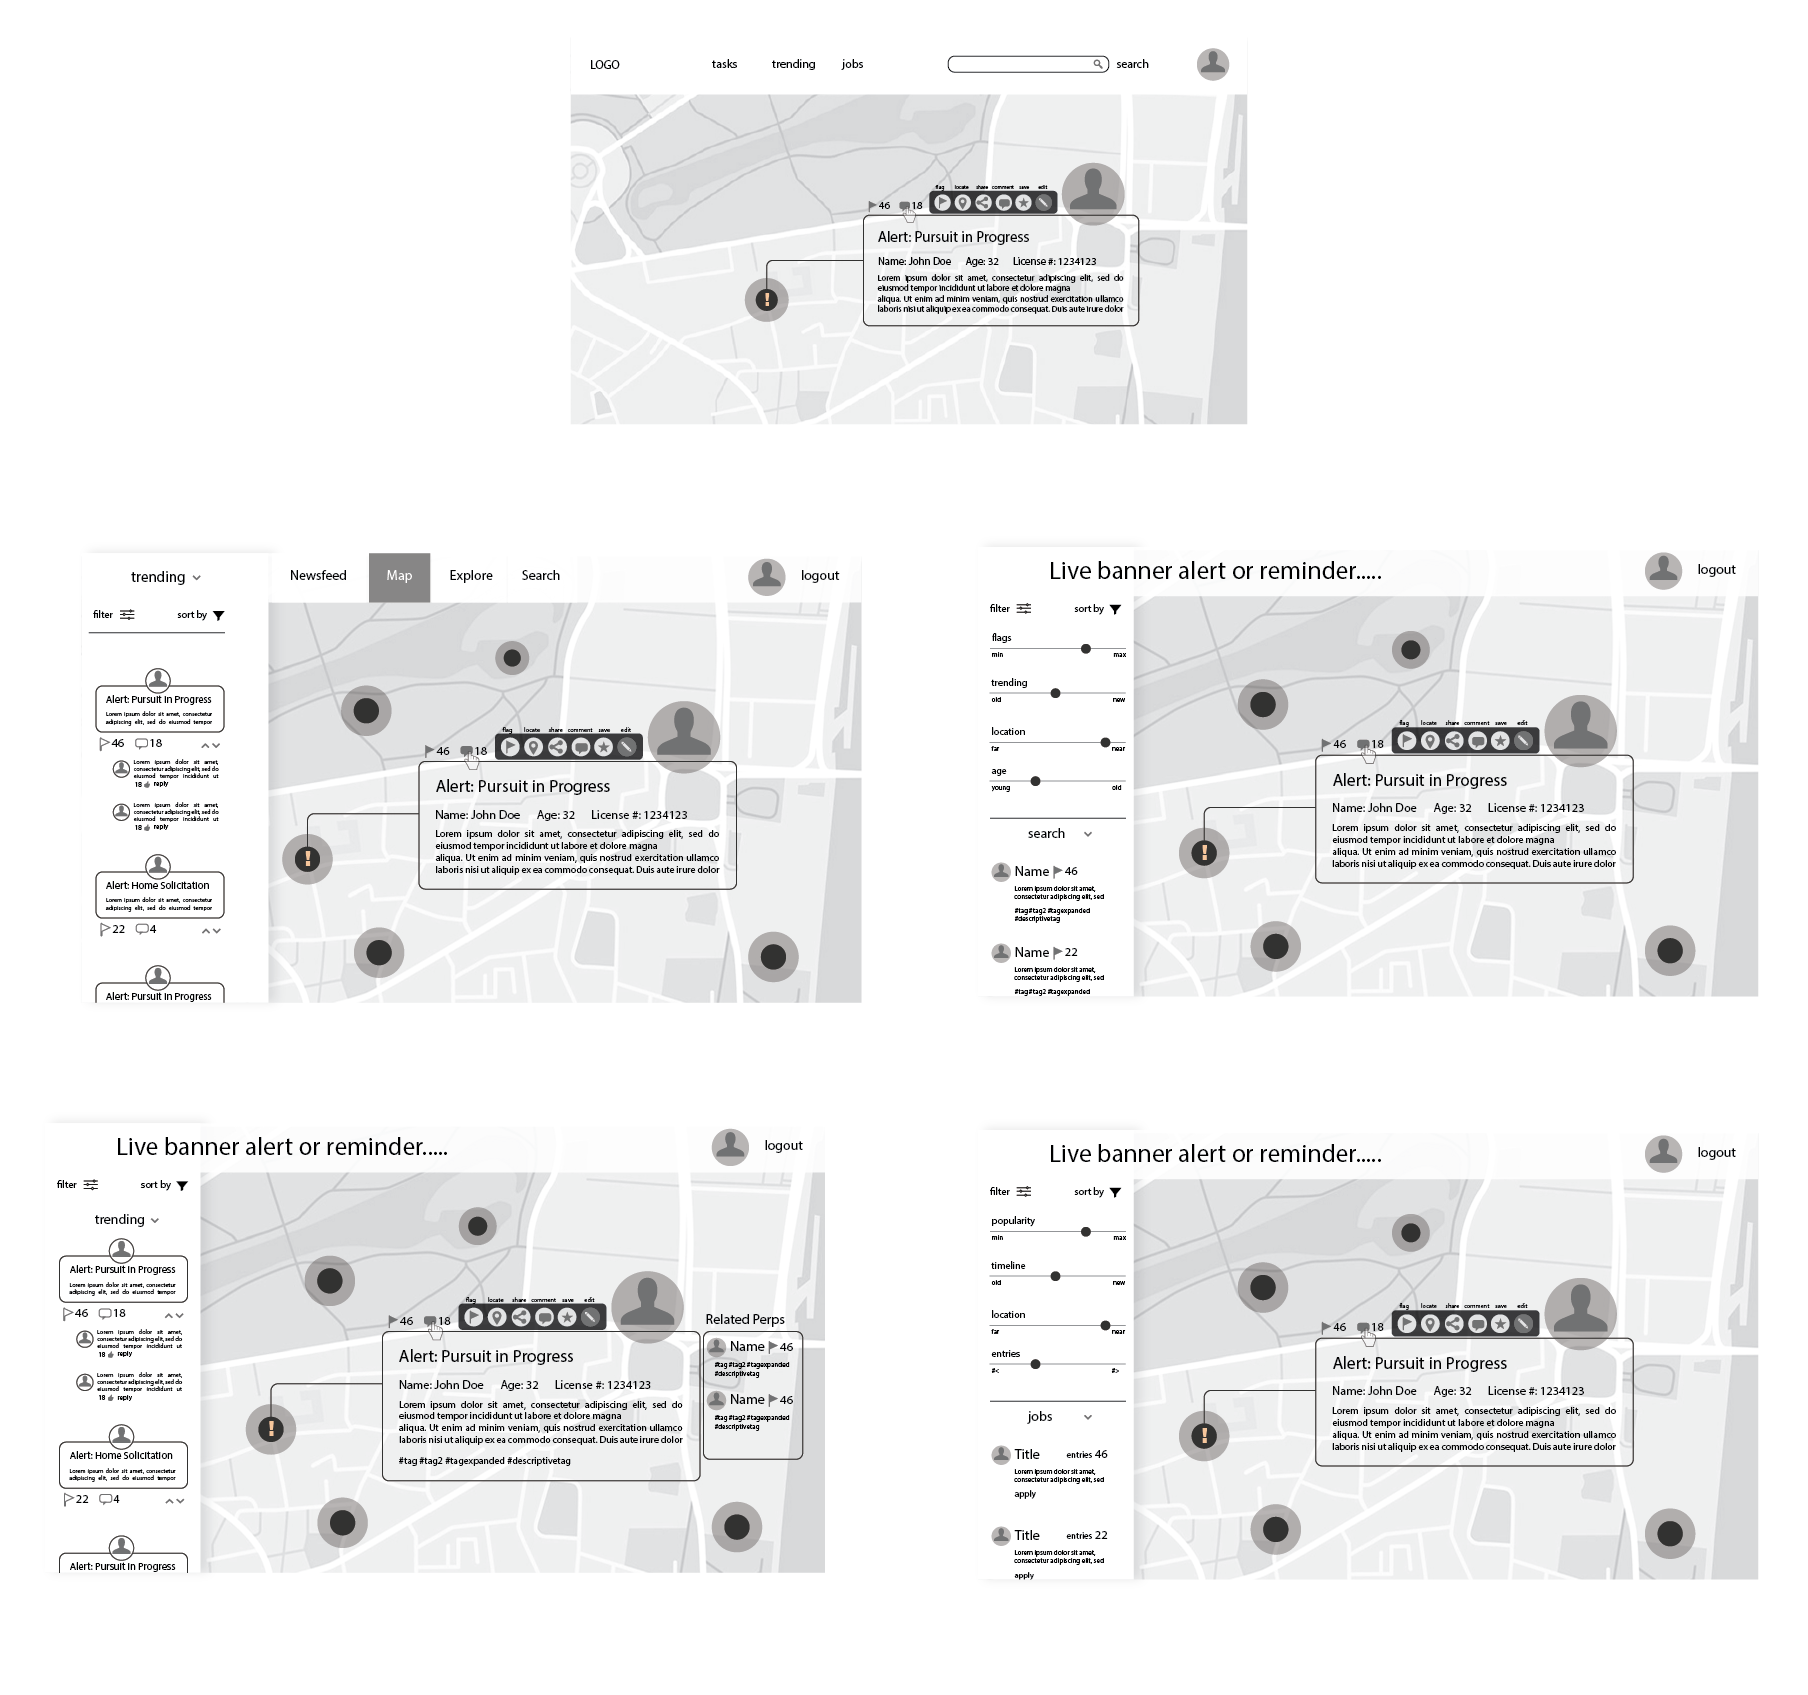
Wireframe Feedback: No full screen map due to deadline limitations, less focus and significance of the map, more abbreviated sort and filter, accommodate broader data visualization capabilities, include data visualization panel.

- Solution: Due to time constraints we implemented all requested iterations to the next rounds of visual design. “At a glance” was the operative word. We went to work to display a series of visualizations that would give the users a swift and robust level of knowledge in no time.
- Specs:
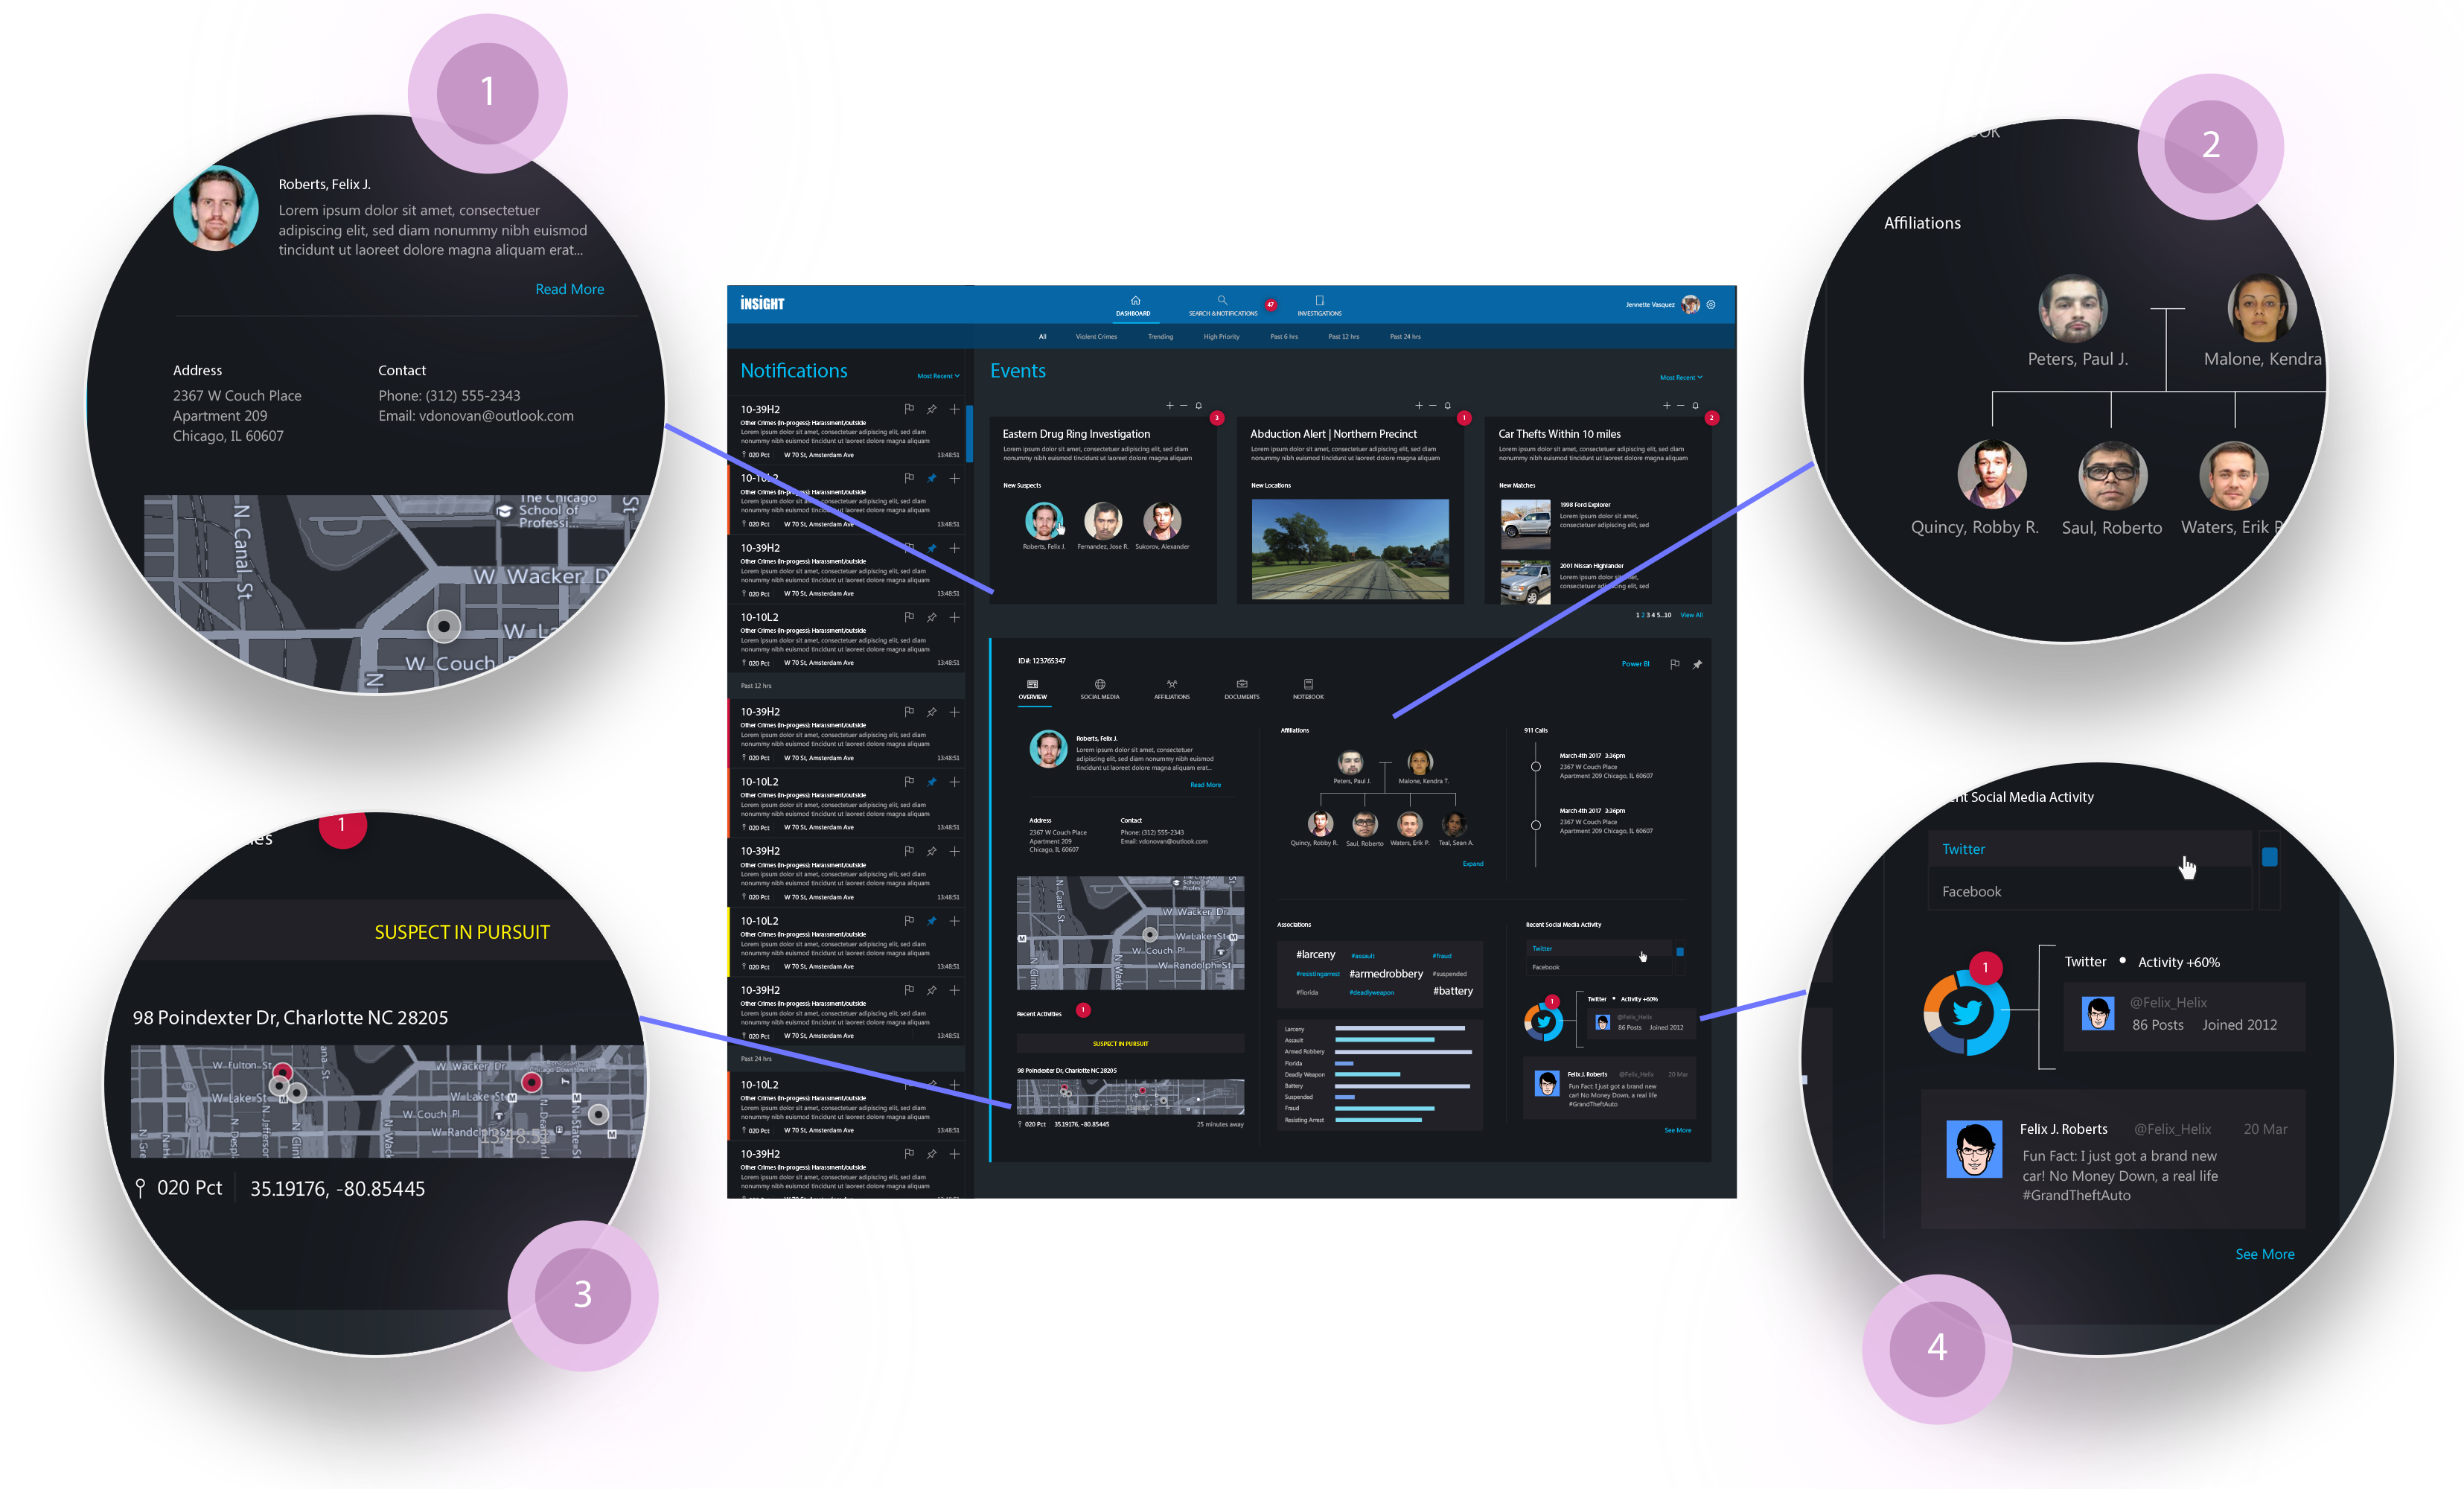
- Suspect Identifier: Allows users to process an image of the suspect with basic information about their age, last known address and prior incidents at a glance.
- Affiliation Tree: This chart quickly illustrates any known criminal connections to the aforementioned suspect in order of relevance.
- Live Locator: In the event of a high-speed pursuit, correspondents will be one step ahead with a live gps reading of live feeds to triangulate a suspect’s location
- Social Media Inspector: Identifies any recent posts made by suspect’s social media account

